工程師管理的電腦系統可能很多台,一定都會有方便的工具來輔助,不管是監控或是拉資料做報告,今天分享的 Process Meter 就可以很快地拉出系統狀態圖表,雖然說樣式感覺很陽春,但是也很工程師 Style 啊!工具軟體打開之後,截張圖片就可以做報告,或是即時分析系統狀態的異常,小小工具雖然功能不是符合所有朋友都使用,不過對於工程師說或許還算實用吧!
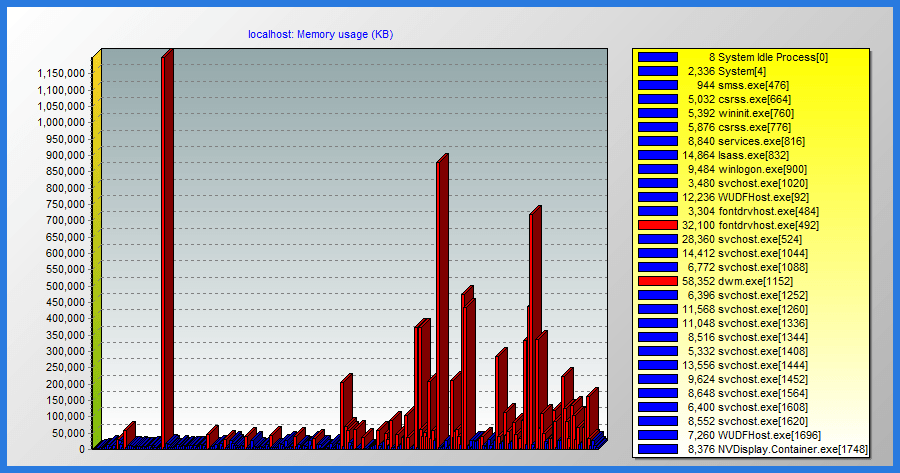
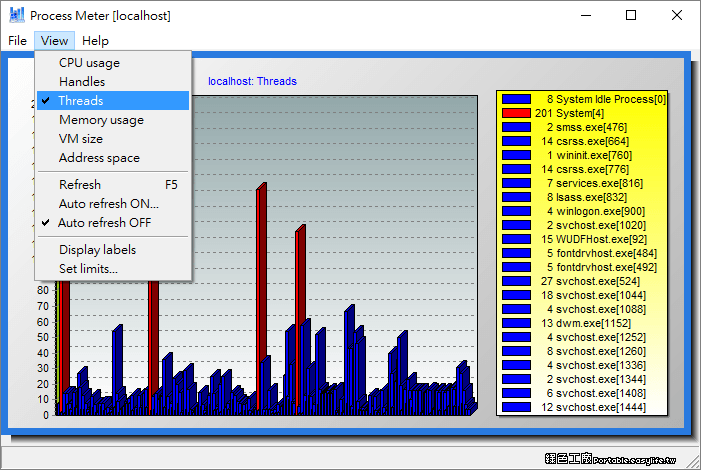
資料一共有 6 種不同的圖表,有 CPU usage、Handles、Threads、Memory usage、VM size 與 Address space,對我來說大概也只有對於 CPU 和記憶體比較理解,其他資訊對我來說無用^^,還是趕快推薦更適合的人吧!
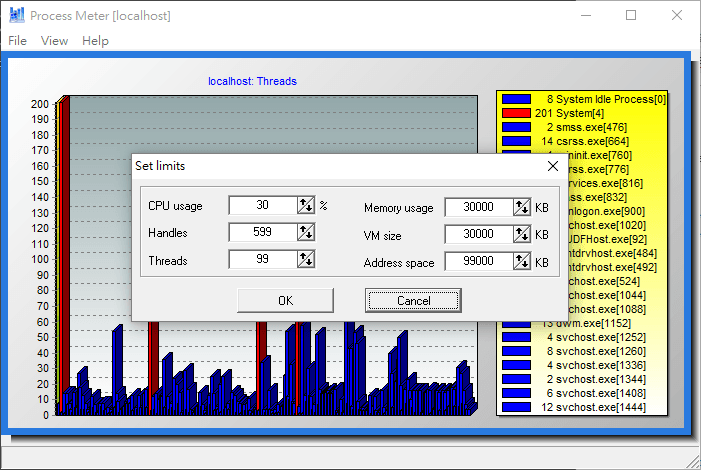
>processmeter.exe [-host:] [-user:] [-pswd:] [-mode:] [-limit:] Where - host name or IP address of the destination host. If this parameter is not specified, application will check local system - this parameter allows you to specify account that should be used for connection with remote system - password for connection. If password contains space character(s), use quotation marks to wrap parameter - one of the following strings: cpu、handles、threads、memory、vmem、addrspace - using this parameter you may setup threshould for specified "view" mode (see "-mode" parameter). Process Meter will show red colored bar when a process uses resources over specified limit. Note: when you are using "memory", "vmem" or "addspace" mode, limit is specified in KB (e.g. "-limit:5000" sets threshold to 5,000 KB)